Data analysts, engineers, or scientists… No matter what title we work under, the most exhausting process for all of us is making data ready for processing. Even if we just want to visualize the data using Power BI, we first need to dive into Power Query to make the data modelable. Similarly, if we plan to build models with machine learning, we must first explore and prepare the data. That’s why data preprocessing, organizing, cleaning, and transformation become the most critical phases of data analytics processes.

The “Data Wrangler” tool, part of the Data Science layer in Microsoft Fabric, assists your data preparation processes by detecting unexpected anomalies in your datasets (e.g., outliers, missing or incorrect information, duplicate rows, logical errors) without requiring you to write any code.
Like Power Query, the Data Wrangler simplifies data transformation processes. However, it takes this a step further by generating and displaying pandas or PySpark code for every operation. This not only transforms your data but also provides learning opportunities for those without coding experience.
Let’s get started!
1. Creating Pandas or Spark DataFrames
You can make the Data Wrangler tool operational by converting any file format in your Lakehouse (that can be transformed into a pandas or Spark DataFrame) into a dataframe.
# read csv file
df = spark.read.format("csv").option("header", "true").load("Files/example_dataset.csv")

# df now is a Spark DataFrame containing CSV data from "Files/Raw Data.csv".
display(df)

print(df.head())
# create Pandas DataFrame from Spark df
pandas_df = df.toPandas()

print(pandas_df.head())
The Data Wrangler supports both pandas and Spark DataFrames.

2. Data Wrangler Interface
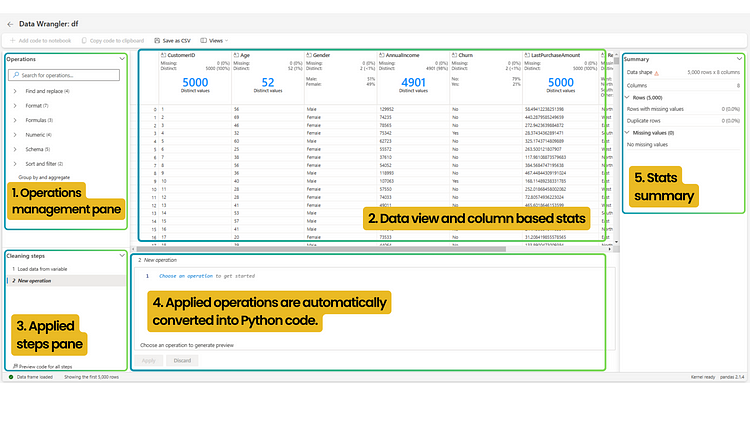
The tool features a user-friendly interface and consists of five panels. The “Operations” panel (1), where you can apply predefined operations; the main data view (2), where you can examine the data in row and column format; the panel (3) displaying applied operations and allowing you to delete them; the panel (4) showcasing the Python code generated for each operation; and the summary panel (5), containing statistics for the entire dataset or selected columns.
3. Example Operations
The no-code feature allows you to generate statistics for your data and easily make your dataset processable (modelable) thanks to its intuitive interface. Here are a few examples:
- You can sort, filter, rename columns, or most importantly, change the data type of a column.

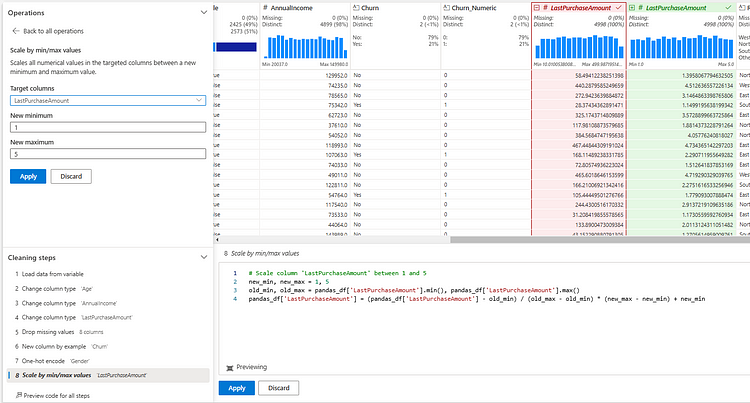
1.1. For the operations you perform, the existing state (red) and the proposed changes (green) are displayed in separate columns. This allows you to review the changes before applying them.

2. You can create a new column based on a reference column.

3. You can perform normalization by scaling the values in the dataset to a specific range (e.g., 0 to 1 or 1 to 5).
4. You can perform “one-hot encoding” by creating a separate column for each unique value of a categorical variable (e.g., “Gender”).

Note: As shown in the image above, it is important to note that you cannot manually edit the code generated by the Data Wrangler tool. However, you can transfer the code (in pandas or PySpark format) to MS Fabric notebooks to carry out your work.

4. All Operations
The Data Wrangler includes a total of 27 operations organized under 8 main categories.

– Find and Replace
- Drop duplicate rows: Removes duplicate rows, retaining only one instance of rows with identical values.
- Drop missing values: Removes rows with missing values. This operation can lead to data loss, so it should be used carefully.
- Fill missing values: Fills missing values in the dataset. You can use a specific constant value or the column’s mean/median value to fill the gaps.
- Find and replace: Finds a specific value and replaces it with another. For example, it can be used to replace “Male” with “M”.
– Format
- Capitalize First Character: Converts the first character of text values to uppercase.
- Convert Text to Lowercase: Converts all text to lowercase.
- Convert Text to Uppercase: Converts all text to uppercase.
- String Transform by Example: Transforms text based on an example input.
- DateTime Formatting by Example: Converts date and time values into a specific format.
- Split Text: Splits text into multiple columns based on a specified delimiter (e.g., space, comma).
- Strip Whitespace: Removes leading and trailing whitespace from text values.
– Formulas
- Multi-label Binarizer: Splits categorical data into multiple new columns and assigns a 0 or 1 value for each category.
- One-hot Encode: Separates the values in a single categorical column into individual columns for each category and encodes them as 0/1.
- Calculate Text Length: Calculates the character length of each value in a text column.
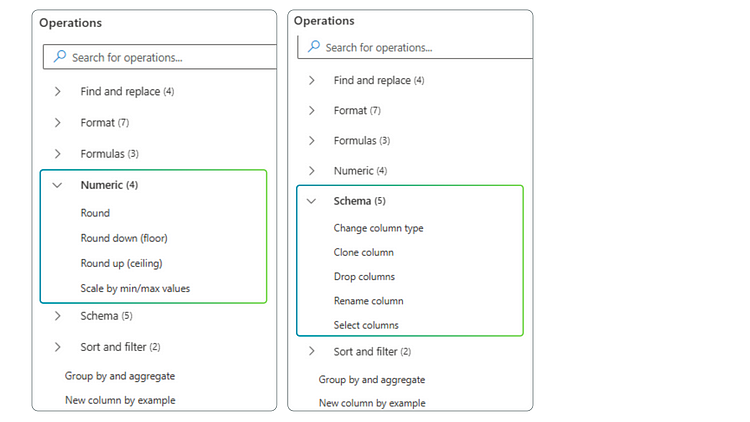
– Numeric
- Round: Rounds a numeric value to the nearest integer.
- Round Down (floor): Rounds numeric values down to the nearest smaller integer.
- Round Up (ceiling): Rounds numeric values up to the nearest larger integer.
- Scale by Min/Max Values: Scales all numeric values in a column to a specific range (e.g., 0 to 1).
– Schema
- Change Column Type: Changes the data type of a specific column.
- Clone Column: Creates a copy of an existing column.
- Drop Columns: Removes specific column(s) from the dataset.
- Rename Column: Changes the name of a specific column.
- Select Columns: Selects only specific columns from the dataset.
– Sort and Filter
Used for sorting and filtering data.
– Group by and Aggregate
Used to group data by one or more columns and perform calculations for each group.
– New Column by Example
Creating a new column using an example. This operation automatically performs transformations in the column based on the user’s example inputs.
Thank you for reading!
You can also access the Turkish version of the article.
References
- https://learn.microsoft.com/en-us/fabric/data-science/data-wrangler
- https://learn.microsoft.com/en-us/fabric/data-science/data-wrangler-spark
- https://aayushgupta9125.substack.com/p/accelerate-data-prep-with-data-wrangler?r=1btttw&utm_campaign=post&utm_medium=web&triedRedirect=true
- https://www.youtube.com/watch?v=EzSStWnyLkc
- https://www.udemy.com/share/10avrQ3@_vJHVws– wv3EnC24pH8DAdN6WjPgAAi3To7WinhPkGszBGo3t1ES6P6rQN0dMXO5/
In my previous article I talked about how you can easily move and organize your folders on the desktop to lake houses with OneLake File Explorer. Please check it out.