The question posed at a meeting I attended recently was: “Who is the customer?”. In order to get the answer to this question that stick to my mind, I started to list all the companies that I am a customer of. Firstly, I started with the phone in my hand. The company that manufactures the phone, the company that sold the phone to me, the telecommunications company that provides the access infrastructure. As I continued, I noticed the water bottle on my desk. I also noted the delivery company I used to order. The bookstore where I order new ones, the bank I prefer to pay, the series-film application I use to spend my spare time… The list got longer and longer, and as a result, I found the answer to the question. “Everyone is a customer. Companies are as valuable as the sum of their customers.”
Number of customers is one of the most important success criteria in subscription-based businesses. Financial value of the company, its position in the sector and its sustainability are directly proportional to the number of customers. For these reasons, by tracking the purchasing behavior of your customers, the profile of customers who are likely to stop working with you is determined, and the process of predicting those with a high probability of leaving is called “Churn Analysis”.
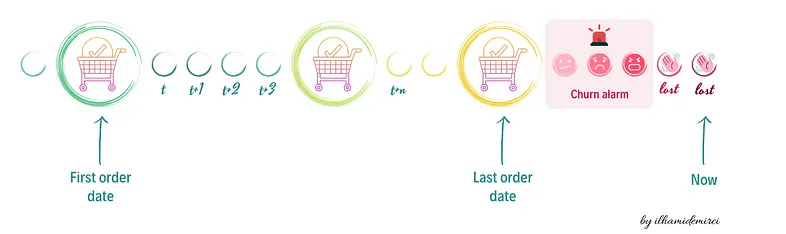
I would like to narrate the Churn analysis by storytelling. Imagine that you subscribe to a mobile application belonging to a shopping company. You discovered the application, added your products to your basket and placed your first order. It is possible that you even won a special discount on your first order. With this motivation, you placed your second or maybe third order in the same month. When you placed your fourth order, you experienced that it was not delivered to you within the time you expected. In your fifth order, you encountered problems at the payment stage, you experienced a delay again, and after the 60th day of your subscription, you did not order from that application again. When the company analyzes your order behavior, they will see that there are 60 days between the last and first order date, and a total of 5 orders in the system. Based on this information, your order frequency ((last order date-first order date) / total number of orders) will be calculated as 12. You are expected to place an order again on the 72nd day, but since you did not place an order, you will join the customer segment that is likely to churn from the 73rd day. Alarms have started to sound and the company needs to take action quickly. In such a case, companies should take steps to improve the customer experience and not lose you, by offering small gifts such as campaign messages, discount coupons, or by collecting feedback through direct communication. Because acquiring new customers is more costly than retaining an existing customer. The customer you lose will go to the competitor for better service, and dynamic competitors will always be more likely to gain business from your customer base.
Communication-trust-feedback-empathy-customer focus are parts of an inseparable whole. If everyone closed their Facebook account today, the market value of the billion-dollar company would be zero. For these reasons, it is critical to collect data correctly, perform correct analyzes and take action by understanding the customer.
Sometimes you may not win. But never lose!